


How Do We Read the Balance Sheet of the Company?
To understand the financial position of any company or organization, we first have to understand the company’s financial statement. Financial statements include the Balance sheet, Income Statement, and Cash flow Statement. Suppose you are a corporate shareholder or potential investor. In that case, it is essential to understand the format of the balance sheet, how to read it, and the fundamentals of balance sheet analysis.
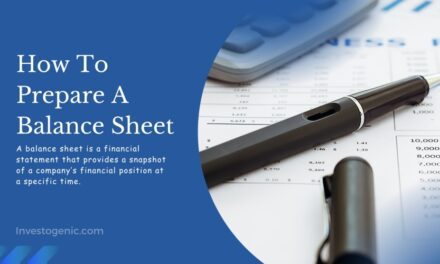
What is a Balance Sheet?
A balance sheet is a financial statement that provides a snapshot of a company’s financial position at a specific time. It presents a summary of a company’s assets, liabilities, and shareholders’ equity, and it follows the fundamental accounting equation:
Assets = Liabilities + Shareholders’ Equity
Understanding the Balance Sheet Items
The balance sheet is one of the three key financial statements used to assess the financial health of a company. It provides a snapshot of the company’s financial position at a specific time. Here’s a breakdown of the components and how to interpret them:
Assets: Assets represent what the company owns or controls. Assets are typically categorized into current assets and non-current (or long-term) assets.
- Current Assets: These are assets expected to be converted into cash or used up within one year. Common examples include cash, accounts receivable, inventory, and short-term investments.
- Non-current Assets: These are assets with a longer-term useful life, such as property, plant, and equipment, long-term investments, intangible assets, and goodwill.
The total assets represent the company’s resources and provide insights into its ability to generate future cash flows.
Liabilities: Liabilities represent the company’s obligations or debts. Like assets, liabilities are also divided into current liabilities and non-current (or long-term) liabilities.
- Current Liabilities: These are obligations due within one year, including accounts payable, short-term loans, accrued expenses, and the current portion of long-term debt.
- Non-current Liabilities: These are long-term obligations that are due beyond one year, such as long-term loans, bonds, and deferred tax liabilities.
Liabilities reflect the company’s sources of financing and the claims of creditors on its assets.
Shareholders’ Equity: Shareholders’ equity represents the residual interest in the company’s assets after deducting liabilities. It is also referred to as net worth or shareholders’ capital. Shareholders’ equity consists of the following components:
- Share Capital: It represents the amount of capital raised through the issuance of shares to shareholders.
- Retained Earnings: These are the accumulated profits or losses retained in the company after dividends have been paid to shareholders.
Shareholders’ equity reflects the shareholders’ ownership stake in the company and is an indicator of its financial health.
Interpreting the balance sheet involves analyzing the relationship between assets, liabilities, and shareholders’ equity. Key ratios and metrics can be derived from the balance sheet, such as the current ratio (current assets divided by current liabilities) and the debt-to-equity ratio (total liabilities divided by shareholders’ equity). These ratios provide insights into liquidity, solvency, and financial leverage.
It’s important to note that the balance sheet represents a specific moment in time and should be analyzed in conjunction with other financial statements, such as the income statement and cash flow statement, to gain a comprehensive understanding of the company’s financial performance and position.
Purpose of the Balance Sheet
The balance sheet is a financial statement that provides a snapshot of a company’s financial position at a specific time. Its purpose is to present a summary of a company’s assets, liabilities, and shareholders’ equity, allowing stakeholders to assess the business’s financial health, solvency, and liquidity.
Here are the key purposes of the balance sheet:
- Financial Position: The balance sheet provides a comprehensive view of a company’s financial position by listing its assets, liabilities, and shareholders’ equity. It helps stakeholders, including investors, creditors, and management, understand the company’s resources, obligations, and ownership claims.
- Assessing Liquidity: By detailing a company’s current assets and current liabilities, the balance sheet helps evaluate its short-term liquidity or ability to meet its financial obligations in the near future. The comparison of current assets to current liabilities gives insights into a company’s working capital and its ability to cover its short-term liabilities.
- Solvency Analysis: The balance sheet assists in evaluating a company’s long-term solvency or ability to meet its long-term obligations. By examining the composition of assets and liabilities, stakeholders can assess the company’s financial stability and its capacity to repay long-term debts.
- Evaluating Financial Health: Through the balance sheet, stakeholders can analyze various financial ratios and metrics that indicate the company’s financial health. For example, the debt-to-equity ratio compares a company’s debt to its shareholders’ equity, providing insights into its leverage and risk profile.
- Comparisons and Decision Making: The balance sheet enables comparisons between different periods or with industry peers. By tracking changes in assets, liabilities, and equity over time, stakeholders can identify trends, evaluate performance, and make informed decisions regarding investments, loans, or strategic initiatives.
- Compliance and Reporting: The balance sheet is a crucial component of financial reporting for businesses. It provides essential information for regulatory compliance, tax purposes, and external financial reporting to stakeholders such as shareholders, lenders, and government authorities.
Overall, the balance sheet plays a vital role in providing a clear and concise representation of a company’s financial position, which helps stakeholders make informed decisions, assess risks, and evaluate the overall health and stability of the business.
The Balance Sheet equation
The balance sheet equation, also known as the accounting equation, is a fundamental principle in accounting that represents the relationship between a company’s assets, liabilities, and shareholders’ equity. The equation is as follows:
Assets = Liabilities + Shareholders’ Equity
This means that the assets used to operate the company are balanced by the company’s financial obligations, along with the equity investment brought into the company and its retained earnings.
The breakdown of each element of the equation is as follows:
- Assets: As we discussed above, Assets are the economic resources owned or controlled by a company. They represent the value that the company possesses and can include cash, accounts receivable, inventory, property, plant, equipment, investments, and intangible assets such as patents or trademarks.
- Liabilities: Liabilities are the company’s obligations or debts to external parties. They represent the claims that creditors and other stakeholders have on the company’s assets. Liabilities can include accounts payable, loans, accrued expenses, deferred revenue, and long-term debt.
- Shareholders’ Equity: Shareholders’ equity, also referred to as owners’ equity or net worth, represents the residual interest in the assets of the company after deducting liabilities. It represents the amount of financing provided by the owners (shareholders) of the company. Shareholders’ equity includes share capital (the amount of capital raised through the issuance of shares) and retained earnings (the accumulated profits or losses retained in the company after dividends have been paid).
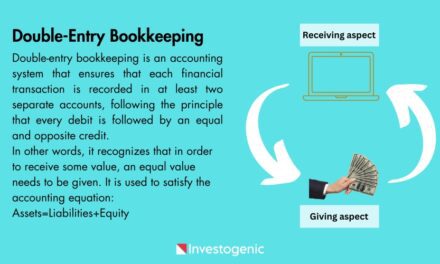
The balance sheet equation reflects the fundamental principle of double-entry bookkeeping, which states that every financial transaction has equal debits and credits. For every transaction, there must be an equal increase or decrease in assets and corresponding changes in liabilities or shareholders’ equity to keep the equation balanced.
The balance sheet equation provides a foundation for financial reporting and helps stakeholders assess a company’s financial position, analyze its resources and obligations, and understand the sources of its financing. It ensures that the assets acquired by a company are financed either by external creditors (liabilities) or by the owners (shareholders’ equity).
How the Balance Sheet Works
A company’s balance sheet is divided into two parts: the top part is assets, and the bottom part is shareholders and liabilities. The balance sheet always satisfies the accounting equation (assets = liabilities + shareholders’ equity). As a result, a balance sheet is always in balance, where the value of assets equals the combined value of liabilities and shareholders’ equity.
How to Read a Balance Sheet
Tools used for analyzing balance sheets
The main technique for reading a balance sheet is financial ratio analysis. Through ratio analysis, we can review the information contained in the balance sheet.
There are several financial ratios that can be used to analyze a company’s balance sheet. These ratios provide insights into the company’s liquidity, solvency, efficiency, and overall financial health. Here are some commonly used ratios for balance sheet analysis:
- Current Ratio: It measures a company’s ability to meet its short-term obligations. It is calculated by dividing current assets by current liabilities. A higher current ratio indicates better short-term liquidity.
- Quick Ratio (or Acid-Test Ratio): This ratio is similar to the current ratio but excludes inventory from current assets. It measures a company’s ability to meet short-term obligations without relying on inventory sales.
- Debt-to-Equity Ratio: It compares a company’s total liabilities to its shareholders’ equity. It indicates the proportion of debt financing relative to equity financing. A higher ratio suggests higher financial risk and dependence on debt.
- Debt Ratio: It measures the proportion of a company’s total assets financed by debt. It is calculated by dividing total liabilities by total assets. A higher debt ratio indicates higher leverage and financial risk.
- Return on Assets (ROA): It evaluates a company’s efficiency in generating profits from its total assets. It is calculated by dividing net income by average total assets. A higher ROA indicates better asset utilization and profitability.
- Return on Equity (ROE): This ratio assesses a company’s profitability from the perspective of its shareholders. It is calculated by dividing net income by average shareholders’ equity. A higher ROE indicates better profitability and efficiency in generating returns for shareholders.
- Asset Turnover Ratio: It measures a company’s ability to generate sales from its total assets. It is calculated by dividing net sales by average total assets. A higher asset turnover ratio indicates better asset utilization and efficiency.
These ratios provide a snapshot of a company’s financial position and can be used to compare performance across different periods or against industry benchmarks. However, it’s important to consider these ratios in conjunction with other financial statements and factors to get a comprehensive analysis of a company’s financial health.
Example
For analyzing purposes, we can here take the example of Apple Inc.’s Balance sheet.

As you can see from the balance sheet above, Apple Inc. had a large cash position of $20.53 billion in December 2022 and inventories valued at over $6.82 billion. This is matched on the liabilities side by $57.91 billion in accounts payable, likely money owed to the vendors and suppliers of many of those goods.
Subtracting total liabilities from total assets, Apple Inc. had a large positive shareholders’ equity value, over $56.72 billion.
Looking at Apple’s balance sheet above, we can see that the current ratio for December 2022 was:
- Current ratio = Current Assets/Current Liabilities
= $128,777 / $137,286
= 0.93
An ideal current ratio is between 1.2 to 2, meaning the business has 2 times more current assets than liabilities to cover its debts. A current ratio below 1 means that the company doesn’t have enough liquid assets to cover its short-term liabilities.
- Debt-to-Equity Ratio = Total Liabilities / Total Shareholders’ Equity
= $290,020 / $56,727
= 5.11
The ideal debt-to-equity ratio is 2:1. This means that at no given point in time should the debt be more than twice the equity because it becomes riskier to pay back, hence the fear of bankruptcy. A business should generally aim for a lower Debt-to-Equity ratio since it means there is less debt on its balance sheet. However, this will also change based on the stage of the company’s development and its sector of the market.
For a mature company, a high Debt-to-Equity Ratio can be a sign of trouble because the firm will not be able to service its debts, which can eventually lead to a credit event such as default.
For a growing company, a high Debt-to-Equity Ratio could be a healthy sign of expansion. In all cases, Debt-to-Equity Ratio should be considered relative to a company’s industry and growth stage.
- Debt Ratio = Total Liabilities / Total Assets
= $290,020 / $346,447
= 0.83
A Debt ratio below 1 means Apple Inc. has more assets than liabilities. In other words, the company’s assets are funded by equity instead of loans. The higher the debt ratio, the more leveraged a company is, implying greater financial risk. On the other hand, a debt ratio below 1 means medium leverage and risk.
This is not the complete list of ratios for the balance sheet analysis. Various other ratios are available that compare sales or income with balance sheet items like Return on Assets (ROA), Return on Equity (ROE), and Asset Turnover ratio, which can be used to analyze the balance sheet.
For the analysis of the Balance sheet, ratios play a very important role. Balance sheets provide only a picture of the company’s position, while ratios provide the capability to understand this picture.
FAQs
Where do we find the balance sheet of the company?
You can download a company's balance sheet directly from the company's website. If the company is listed, then you can find the balance sheet of the company on the website of the stock exchange and also on other financial websites.